ROS 2 Communication Comparison
This page defines the small comparison track used to calibrate Librux Event communication numbers against ROS 2 communication paths on the same hosts.
The goal is not to build a broad communication benchmark suite. Use this track to
answer one question first. What latency floor do the host, network, kernel, ROS
2 executor, rclcpp, and RMW layer allow before interpreting Librux cross-host
results?
Do not mix release smoke measurements into the comparison tables. Release smoke runs use small counts to validate installability and path correctness. The comparison data below comes from controlled matrix runs on the same hosts and is the only data on this page that should be used for ROS 2 interpretation.
Scope
Run the comparison in this order.
- ROS 2 path with the
performance_testROS 2 plugin andrmw_cyclonedds_cpp. - ROS 2 path with the same plugin and
rmw_fastrtps_cpp. - Librux Event path with the existing Librux communication matrix.
For cross-host latency, prefer round-trip mode and interpret one-way latency as roughly half of the reported round-trip value. One-way timestamps across hosts are useful for Librux debugging, but they depend on clock synchronization.
The stock performance_test timestamp path uses std::chrono::steady_clock.
That clock is monotonic per host and is not synchronized by PTP or NTP, so stock
performance_test one-way latency is not valid across hosts. Use round-trip
mode for strict cross-host numbers. A local system_clock rebuild can be used
as a diagnostic variant, but sub-50 us one-way values should be treated as
clock-offset-limited unless the clock discipline is independently verified.
When both hosts have accepted hardware PTP or hardware-backed Librux logical clock
evidence, one-way cross-host rows can be reported as an accepted track. Otherwise
label one-way ROS 2 rows as diagnostic and keep RTT as the strict comparison.
Test Host Assumptions
Use two equivalent Ubuntu hosts on the same network segment when comparing cross-host behavior. For Ubuntu 24.04, the matching ROS 2 deb-package track is ROS 2 Jazzy.
Setup
Install ROS 2 Jazzy and the RMW packages on both hosts, then make sure
performance_test is available. If your environment does not provide a package
for performance_test, build it from source with the same compiler and ROS 2
environment on both hosts.
Manual setup sketch.
sudo apt update
sudo apt install -y ros-jazzy-rmw-cyclonedds-cpp ros-jazzy-rmw-fastrtps-cpp
source /opt/ros/jazzy/setup.bash
Run
Run the same payload, rate, and subscriber matrix for each RMW implementation. Use round-trip mode for strict cross-host interpretation, or document any one-way clock discipline separately.
Example environment selection.
export RMW_IMPLEMENTATION=rmw_cyclonedds_cpp
source /opt/ros/jazzy/setup.bash
Then run the publisher/subscriber pair with the chosen performance_test
options on the two hosts. Repeat with this command.
export RMW_IMPLEMENTATION=rmw_fastrtps_cpp
For the fanout track, use subscriber counts 1,2,4,8,16 and payloads 64 B,
1 KiB, and 4 KiB at 1000 Hz.
For the extended comparison track, use staged profiles rather than a single large run.
| Stage | Payloads | Subscriber counts | Purpose |
|---|---|---|---|
| Smoke | 64 B, 1 KiB, 4 KiB | 1,2,4,8,16 | verify setup and artifact capture |
| Coarse | 8 B-1 MiB subset | 1-256 | identify payload and fanout slope changes |
| Full | 8 B,64 B,256 B,1 KiB,4 KiB,16 KiB,64 KiB,256 KiB,1 MiB | 1,2,4,8,16,32,64,128,256 | official comparison candidate |
| Stress | 8 B Librux / small ROS 2 array message | 512,1024 | limit finding outside the official comparison envelope |
Before the full Librux leg, run tools/qa/run_comms_matrix.py --plan-only with
the same matrix profile and review the generated SHM resource plan. Increase
/dev/shm, reduce queue depth, or split the large-payload fanout cases if the
plan reports burst pressure warnings.
The ROS 2 runner has the same profile names. Use full for accepted
comparison tables and stress only for high-fanout limit finding.
python3 tools/qa/run_ros2_performance_baseline.py \
  --host-a <host-a> --host-b <host-b> \
  --matrix-profile full \
  --fanout --plan-only
performance_test uses its own supported message names, so the ROS 2 full
profile maps the payload axis to array messages such as Array1k, Array4k,
Array16k, Array60k, and Array1m. Keep the raw manifest with the report so
the exact message set is visible.
For shared Librux / ROS 2 planning, prefer the transport matrix runner before executing either stack.
python3 tools/qa/run_transport_matrix.py \
  --profile tools/qa/matrix_profiles/transport_comparison_smoke.yaml
The shared runner expands the same matrix into Librux and ROS 2 cases, maps ROS
2 payload sizes to the closest performance_test array message, and writes the
supported and unsupported case list to JSON, CSV, and Markdown. Unsupported rows
are part of the artifact. They show which comparison adapters still need to be
implemented before a larger matrix can be called complete.
Use transport_comparison_full.yaml for official-candidate planning and
transport_comparison_stress.yaml only for limit finding outside the accepted
comparison envelope.
Current implemented shared adapters.
| Runtime | Surface | Supported axis |
|---|---|---|
| Librux | Event fanout | one topic, N subscribers |
| Librux | Event multi-topic | N topics, one subscriber endpoint |
| Librux | Control procedure | one synchronous request/response connection |
| Librux | Timed Exchange | one real-time round-trip connection |
| ROS 2 CycloneDDS / FastDDS | Event fanout | one topic, N subscribers through performance_test |
Current planned adapters.
| Surface | Missing adapter |
|---|---|
| ROS 2 Event multi-topic | multiple performance_test topic launcher |
| ROS 2 procedure | ROS 2 service latency runner |
| ROS 2 operation | ROS 2 action latency runner |
| ROS 2 timed-control reference | explicit periodic service-loop reference |
| Librux Control connection count | concurrent connection runner |
The official comparison envelope stops at N=256. Larger fanout runs are useful for capacity planning, but the observed latency and loss characteristics are dominated by scheduling, local fanout dispatch, and resource limits rather than the low-N communication latency floor.
Reference Results
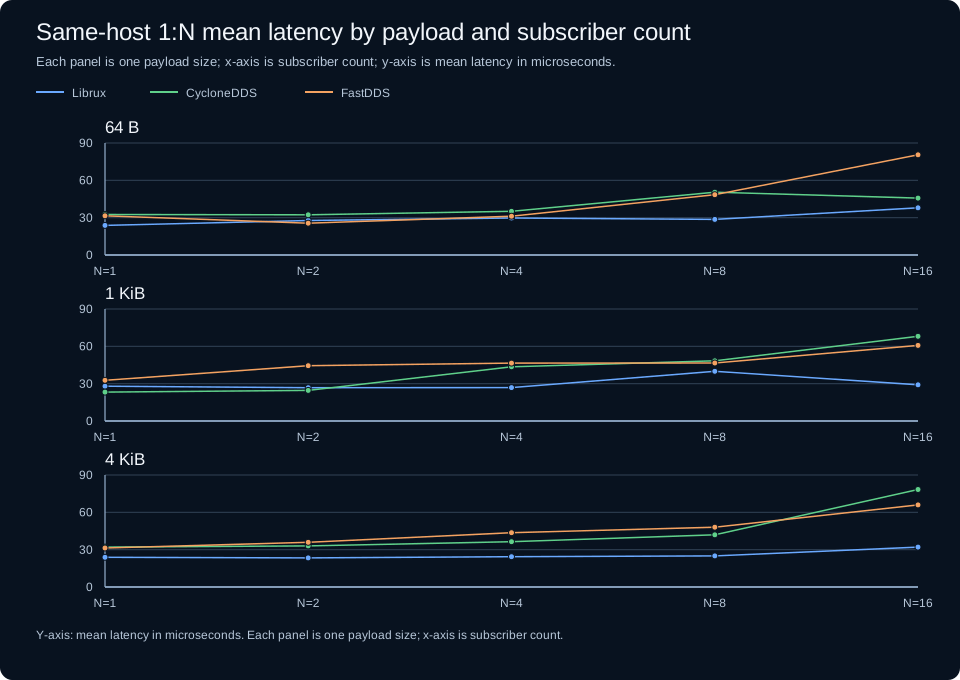
The comparison reference uses 64 B, 1 KiB, and 4 KiB payloads with subscriber fanout N=1,2,4,8,16 at 1000 Hz.
Same-host 1:N summary.
| Stack | Delivery | Mean latency range |
|---|---|---|
| Librux Event | lossless | 23.413-39.963 us |
| ROS 2 + CycloneDDS | lossless | 23.227-78.338 us |
| ROS 2 + FastDDS | loss observed in every fanout row | 25.588-80.485 us |
Because this is a payload-by-subscriber-count matrix, use the range table only as a quick overview. The matrix below preserves the subscriber-count axis.
Same-host mean latency matrix, in microseconds.
| Payload | Stack | N=1 | N=2 | N=4 | N=8 | N=16 |
|---|---|---|---|---|---|---|
| 64 B | Librux Event | 23.808 | 27.715 | 29.772 | 28.627 | 37.935 |
| 64 B | ROS 2 + CycloneDDS | 32.580 | 32.288 | 35.087 | 50.491 | 45.742 |
| 64 B | ROS 2 + FastDDS | 31.486 | 25.588 | 31.159 | 48.493 | 80.485 |
| 1 KiB | Librux Event | 27.984 | 26.734 | 26.828 | 39.963 | 29.071 |
| 1 KiB | ROS 2 + CycloneDDS | 23.227 | 24.555 | 43.564 | 48.412 | 68.055 |
| 1 KiB | ROS 2 + FastDDS | 32.733 | 44.436 | 46.545 | 46.595 | 60.788 |
| 4 KiB | Librux Event | 23.880 | 23.413 | 24.373 | 24.959 | 32.066 |
| 4 KiB | ROS 2 + CycloneDDS | 32.027 | 33.042 | 36.425 | 41.923 | 78.338 |
| 4 KiB | ROS 2 + FastDDS | 31.364 | 35.947 | 43.651 | 48.056 | 65.958 |
The same matrix is shown below as payload-split line charts.
Cross-host 1:N summary.
| Stack | Delivery | Mean latency range |
|---|---|---|
| Librux Event | lossless | 116.631-175.347 us |
| ROS 2 + CycloneDDS system-clock diagnostic | lossless, clock-offset limited | -39.156-80.644 us |
| ROS 2 + FastDDS system-clock diagnostic | loss observed in every fanout row | 39.836-104.686 us |
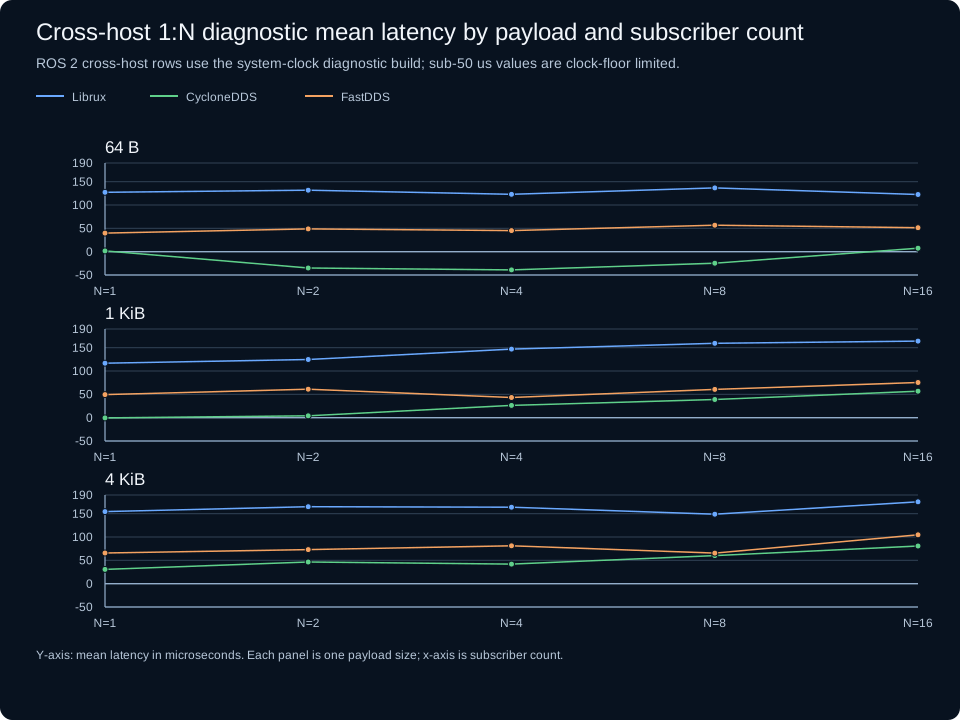
The negative CycloneDDS diagnostic rows are a measurement warning, not negative network latency. They show that the one-way latency is below the reliable clock floor of that diagnostic setup.
These cross-host one-way diagnostic rows are not release acceptance numbers. For strict cross-host comparison, prefer RTT mode or a separately accepted production time-sync track.
Cross-host diagnostic mean latency matrix, in microseconds.
| Payload | Stack | N=1 | N=2 | N=4 | N=8 | N=16 |
|---|---|---|---|---|---|---|
| 64 B | Librux Event | 127.313 | 131.708 | 122.870 | 136.560 | 122.567 |
| 64 B | ROS 2 + CycloneDDS diagnostic | 1.737 | -34.978 | -39.156 | -24.630 | 7.389 |
| 64 B | ROS 2 + FastDDS diagnostic | 39.836 | 48.734 | 45.191 | 56.630 | 51.447 |
| 1 KiB | Librux Event | 116.631 | 124.637 | 146.906 | 159.254 | 164.075 |
| 1 KiB | ROS 2 + CycloneDDS diagnostic | -0.478 | 4.048 | 26.337 | 39.021 | 56.819 |
| 1 KiB | ROS 2 + FastDDS diagnostic | 49.388 | 61.028 | 43.233 | 60.637 | 75.295 |
| 4 KiB | Librux Event | 154.497 | 165.032 | 163.762 | 148.765 | 175.347 |
| 4 KiB | ROS 2 + CycloneDDS diagnostic | 30.533 | 46.425 | 41.907 | 60.206 | 80.644 |
| 4 KiB | ROS 2 + FastDDS diagnostic | 65.760 | 73.000 | 81.086 | 65.490 | 104.686 |
The same diagnostic matrix is shown below as payload-split line charts.
Interpretation
Compare the resulting numbers in three bands.
| Band | Meaning |
|---|---|
| ROS 2 + Cyclone DDS | ROS 2 framework overhead on top of rmw_cyclonedds_cpp |
| ROS 2 + Fast DDS | ROS 2 framework overhead on top of rmw_fastrtps_cpp |
| Librux | Librux runtime, federation, queueing, and transport behavior |
If both ROS 2 RMW paths show high cross-host round-trip on the same hosts, tune the test hosts first. Check CPU governor, C-states, interrupt moderation, NIC offloads, switch path, and background load. If ROS 2 is low but Librux remains high, keep profiling the Librux federation/data-plane path.
References.
- ROS 2 Jazzy Ubuntu deb packages. https://docs.ros.org/en/jazzy/Installation/Ubuntu-Install-Debs.html
- ROS 2 Cyclone DDS RMW package. https://docs.ros.org/en/jazzy/Installation/RMW-Implementations/DDS-Implementations/Working-with-Eclipse-CycloneDDS.html
- Apex.AI
performance_test. https://docs.ros.org/en/iron/p/performance_test/index.html